Datalogging - The pikey way.


Kozy

Bench Racer
Vendor
Joined
Aug 18, 2008
Messages
4,081
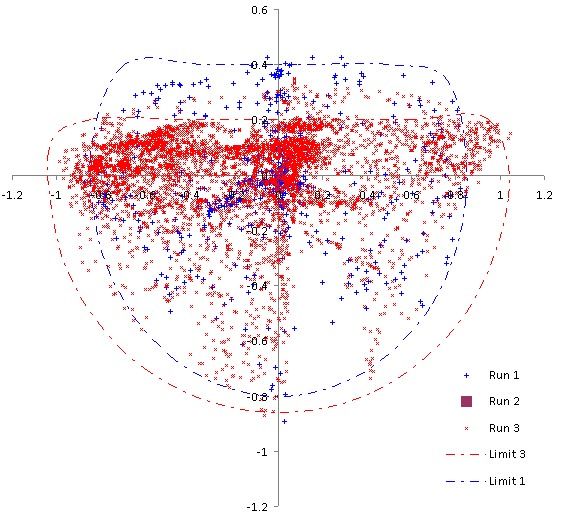
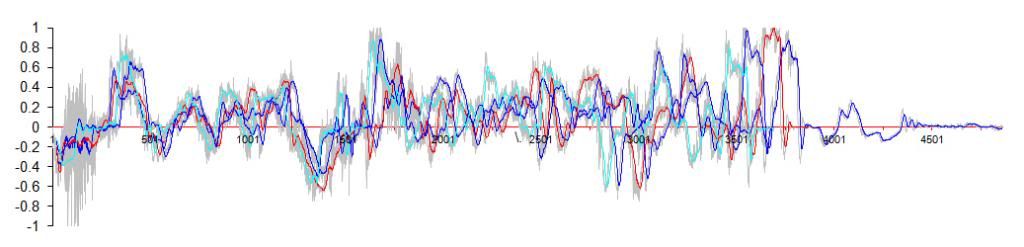
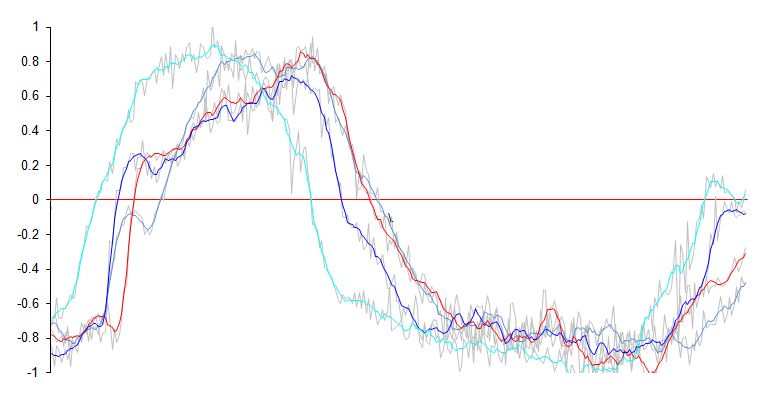
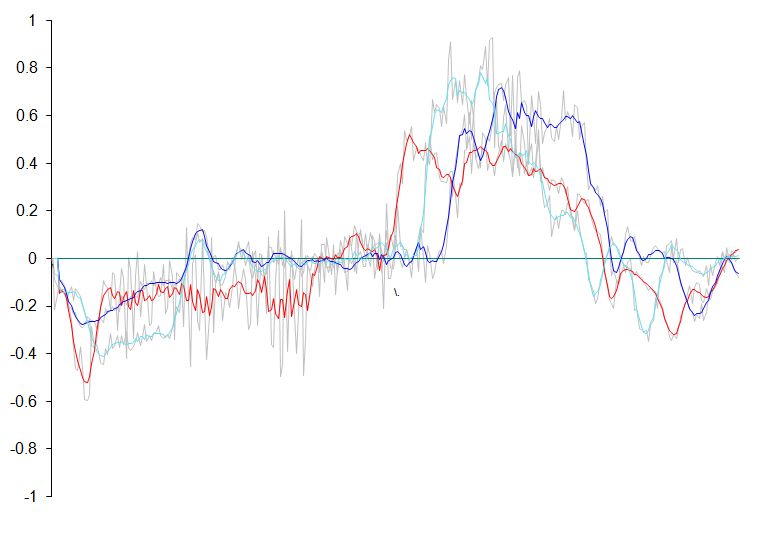
So I was pissing around on excel whilst reading through my new geek bible I remembered I took some pikey style data logs at my last trackday at Brands Hatch. Turns out you can use the basic Ax/Ay accelerometer logs to plot out a G-G diagram, which effectively depicts the friction cirlce of your car. This is a useful tool for highlighting the limits of the vehicle and how close you are getting to those as a driver.

Here's a plot from one of my sessions:
GGDBrandsHatch2011Session1.jpg


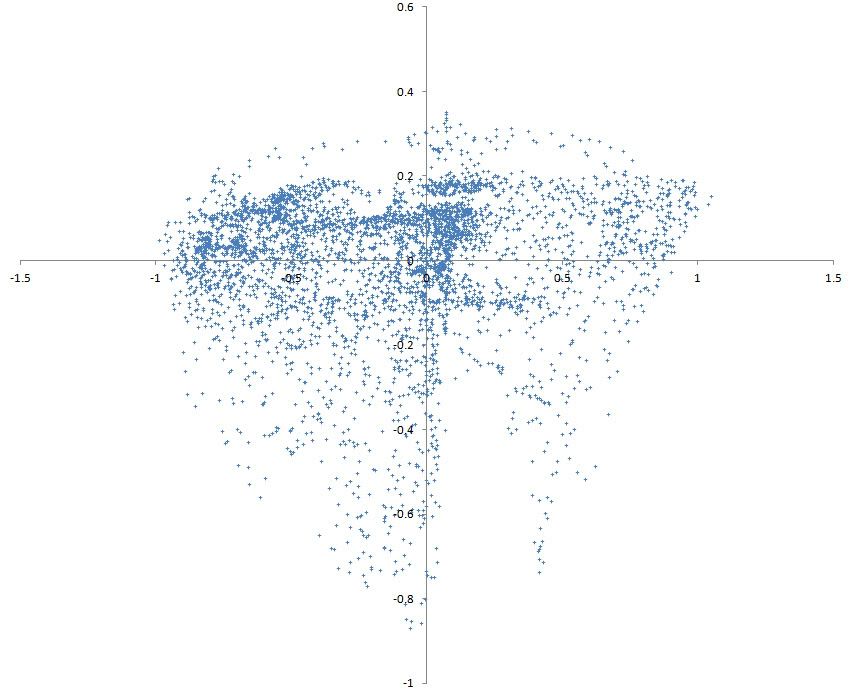
I can see I'm at the limit at about 1G lateral, 0.8G braking and power limited to around 0.3G acceleration. That big gap in the lower left quadrant is either me consitently cocking up a corner (Graham Hill most likely) or simply the fact that there aren't many left hand bends at Brands.

This was really simple to generate, I used the Rev Lite app for my iPhone (free on iTunes) and placed the phone down in the coin tray under the handbrake, held down with a few tabs of blu-tac. After the session the data plots are exported as .csv files to my email address, I can then open them up on my laptop in Excel and simply plot a scatter diagram of both the longitudinal and lateral accelerations. :nice:

Since it's so easy to do, I thought a few of you keen trackdayers might be interested in having a go and comparing some plots?

I will be using this as a driver and vehicle development tool next season. I want to see a higher density of plots around the outer edge of that mess (more consistent limit driving) and to extend those boundaries with better use of the contact patches (better suspension and brake setup).

[/geek]
 
How would you describe your driving style on track?
In a word, crap.
laugh.gif


Lastly, what tires were you running?

195/50/15 Yokohama AD08 up front, 195/50/15 Goodyear eagle F1 on the rear. Also a shite brake setup with the ABS disabled due to too much front bias. You know that brake calculator I wrote, well it predicted a .88G limit with that setup and equal tyres all round. With slighty worse tyres on the rear, this plot shows a slightly worse .87G. Pretty good guess eh? :D

Fun data buddy! Thanks for sharing...I love this stuff.

:nice:
 
Last edited:
Refined this a little bit last night, adding the the traction limit circle/eclipse for the run and also added another plot recorded earlier on the same day.

GGBrandsHatchFeb2011.jpg


IIRC it was raining in the morning which explains the lower lateral and braking limits and the lower speeds would have meant accelerating from a lower gear out of some corners which would explain the increased forwards acceleration.

Clearly I have some work to do in filling out the trail braking areas (sectors 2 and 3 going clockwise), I will be losing a lot of time if I am not fully utilising the available traction on corner entry. The red plot also seems to show that I turn left harder than I turn right. Whether this is due to the car setup (I'm guessing uneven corner weights perhaps?) or my driving I do not know, something to look into though as the circle suggests I can go faster round left handers than I currently do.

Look forward to recording some logs on my autosolo and sprint events this year, hopefully the new brake setup (well, old one) will see sectors 2 and 3 filled out a bit more as the rear end becomes more stable and my balls grow a bit bigger... :D
 
Last edited:
I will probably upgrade to a proper system as I progress, the iPhone only logs basic aX/aY data at 5hz and I found the GPS laptimer to be rubbish, it could never detect a full lap for some reason. Will give Harry's Laptimer a go soon to see if it is any better, costs a (realtively) extortionate £5 though...

The Vbox Mini looks good, I like the addition of a yaw rate sensor, but it's kinda expensive. For now, I am impressed with how much information I can capture with free software, it will suffice for this season while I try and stretch the performance envelope of the car and train myself to consistently drive on those limits.

I've set up the spreadsheet to automatically generate these plots now (can be a bit cumbersome at first) so if anyone wants to send me some data after a trackday I can shoot the results up pretty quickly. Would be cool to see how various cars on the forum stack up against each other! :nice:
 
Had a look on the app store this morning and there are several dedicated sensor capture apps that can sample at 100hz as well as capturing roll, pitch and yaw angles. Seemingly they can do most of what the Vbox can do but for around £5! :D
 
I've only just come across this. you seem to be very good at translating the graphs and finding the correlation. will have to check this out myself and try it out. This is a class way to improve driver development providing you don't try to hard. Less of the extremes and more consistency around the curve will surely improve your time on the track !!

Thanks for sharing man
 
Yes that would be good! I was hoping some of the trackday people here might have been interested in having a go given that it's so simple to do with a smart phone, but seemingly not. :(

Sadly that car is gone now but I'll be using this from the start with the new competition car, whatever it is and whenever it arrives...
 
Last edited:
I have only just seen this looks very interesting I have a track day at brands coming up next month so providing I get my act together and sort this I'll try and get a graph of my own up.

You say it appears that you turn harder to the left than the right would this not depend mostly on track layout at specific corners? At brand the rights like McLaren and Clark are quite long and sweeping even Paddock Hill had quite a large radius in comparison to Graham Hill which fits inside it? Could such a corner influence your data significantly or am i looking at this the wrong way?

Incidently I also found Graham Hill bend tricky getting across to the right after exiting druids intime for a straight braking zone and early turn in is alot to get the mind around.
 
Update. Finally got myself back in competition in my MX5. Bought a proper data capture app and sorted out some better visual data representation:

Copy and pasted from the local club forum:
Warning: This probably won't interest anyone bar perhaps 2 people who are equally as nerdy as me.

Some of you may remember shortly before the demise of **** Mk1, I started looking into smartphone data acquisition, purely because it didn't cost anything and I found it quite interesting.

This started out after using gimmicky apps like RevLite, Dynolicious, Harry's LapTimer etc. The data as presented on screen, even when overlaid over video, was nice looking but not really useful in the slightest. I wondered if, with all that computing power in our pockets nowdays, could you actually glean some decent information from it for the sort of events we do? A couple of quid on a specialised data capture app (without any bells or whistles) and a bit of work with the raw data and you can get something far more useful, particularly if you car share, as you can compare corner by corner and see the lead change over the run.

Sadly, by the time I started to plot the idea out, the **** spun it's wheels for the last time and I didn't bother working on it any more. Now I'm back at the events, I thought I'd make use of the almost purpose made moulding in the 5's centre console, the decent capture app and finish sorting out the spreadsheet I made.

Here's the result of a few hours work pulling the raw data into something remotely useful.

Dataq1_zpsc0fe38c9.jpg

Nothing's labelled on it yet.

Top left, a 'GG plot'. Basically a record of that XY G plot you see on racing games, F1 overlays etc. Essentially shows you your friction circle, and how well you're using it.

I'm not doing a very good job.

Here's my first run in blue, vs fastest in cyan. There are tick boxes for each run to show/hide each data trace.

dataq4_zps60cbad6a.jpg

Those cheapy Uniroyals look suprisingly grippy... :)


Middle left, to lateral acceleration over the full run. Negative is right turns.
dataq5_zps415cbadf.jpg


Bottom left, longitudinal acceleration over the full run. Positive is braking.
dataq6_zpsc8e0889d.jpg

The larger plots on the right are zoomed in versions of the full run plots, which can be scrolled across. In the first image, you can see the zoomed long. acc. one is showing the first section until just after the first braking zone on the full plot.

The grey lines are the raw data, sampled at 80hz. This is too noisy to really be useful, so the coloured lines are each run with some of the noise filtered out. This has created a seriously heavy spreadsheet so it can only hack four runs at 80hz.

Here's a zoomed in plot of the lat. acc. through the first slalom and 180, coming back towards the finish box:

Dataq2_zpsf0dce7b9.jpg


Cyan was my fastest run, clearly a lot smoother than the earlier runs.

Here's acceleration off the line:
dataq3_zps7f4d6207.jpg


Red - Johnnybigpotatoes wheelspin launch.
Blue - Hooked up but bogged down.
Cyan - Hooked up properly​

I'm not expecting this to turn me into a winner or anything of the sort, or for that many people to understand the appeal of going to so much effort to get some colourful squiggles, I just find it interesting to see exactly how and where time is lost and gained, especially given that this sort of stuff is so easy to get now. If a few more people do want to get involved, I think it could be quite interesting to take the four fastest drivers fastest runs and compare them after an event, or for people car sharing to compare.

If there was enough interest, I think with a bit of work this could be incorporated into a website so that users could upload their own logs and compare it against other saved runs. Could make an pioneering web app for local motorclubs. Could just be a load of geeky rubbish too...

Anyhow, that's what I done instead of watching **** on TV this evening...

C&C welcome. :thumbs:
 
Back
Top